ASKE Month 11 Milestone Report
Deployment of multiple-resolution model testing and analysis
We have previously described our progress towards developing a capability to check EMMAA models using causal representations at different levels of resolution. During this reporting period we have deployed multiple-resolution model checking for all models hosted in the EMMAA web application. After processing new literature and assembling the corpus of relevant EMMAA statements, the system assembles the knowledge-level information into the following types of causal representations:
Unsigned directed networks. This model type is a simple directed graph with unsigned, directed edges between entities (molecular entities and biological processes in the case of biological networks).
Signed directed networks. Similar to the unsigned, directed network, in that it is a directed graph over entities and processes, but each edge is associated with a sign indicating whether it represents a positive or negative regulation of activity or amount.
PyBEL networks. A PyBEL network is a particular network representation of causal information encoded in the Biological Expression Language (see https://pybel.readthedocs.io). PyBEL networks are also signed and directed, but the nodes in the network have state: for a given protein X, the mutated, modified, or active forms of X are represented by distinct nodes. The inclusion of state information allows the network to represent more specific preconditions for causal influences.
PySB models/Kappa influence maps. In this representation, the EMMAA Statements are used to instantiate a rule-based model using PySB/Kappa, and the Kappa framework is used to analyze the causal structure of the rules in the model. In a Kappa influence map, the nodes are reaction rules rather than entities, and each edge reflects the positive or negative influence one reaction rule has on another (for example, if rule A produces P as its product, and P is a precondition for the firing of rule B, the influence map will contain a positive edge between rules A and B). Each rule in the PySB/Kappa model is subject to specific preconditions for activity and hence this representation is the most causally constrained. Until this reporting period, PySB/Kappa models were the only form of model representation subject to automatic testing EMMAA.
Each of these four causal network representations represent entities and causal influences differently; the first step in automated checking of causal queries is therefore to ground the entities in the query to nodes in the particular network representation. For example, in the causal query “How does phosphorylated BRAF increase MAPK1 activity”, the subject node is “phosphorylated BRAF” and the object node is “MAPK1 activity” (Figure 1). In the unsigned and signed directed networks, these two concepts map simply to the nodes for BRAF and MAPK1, because these networks do not distinguish based on entity state. In the PyBEL network, there are multiple nodes consistent with “phosphorylated BRAF”, including p(BRAF, pmod(P, S, 602)) (representing BRAF phosphorylated at serine 602) and p(BRAF, pmod(P)) representing BRAF phosphorylated at an unknown site; similarly, there are multiple nodes corresponding to “MAPK1 activity”, including act(MAPK1) and kin(MAPK1), representing the generic molecular and specific kinase activity of MAPK1, respectively. For the PySB/Kappa influence map, there are multiple rules consistent with phosphorylated BRAF as source nodes, and multiple observables corresponding to MAPK1 being in a state consistent with its activity. Checking the model involves identifying these subject and object nodes and then searching for paths linking any subject node to any object node. If any such path is found, then this represents a candidate causal explanation in that representation.
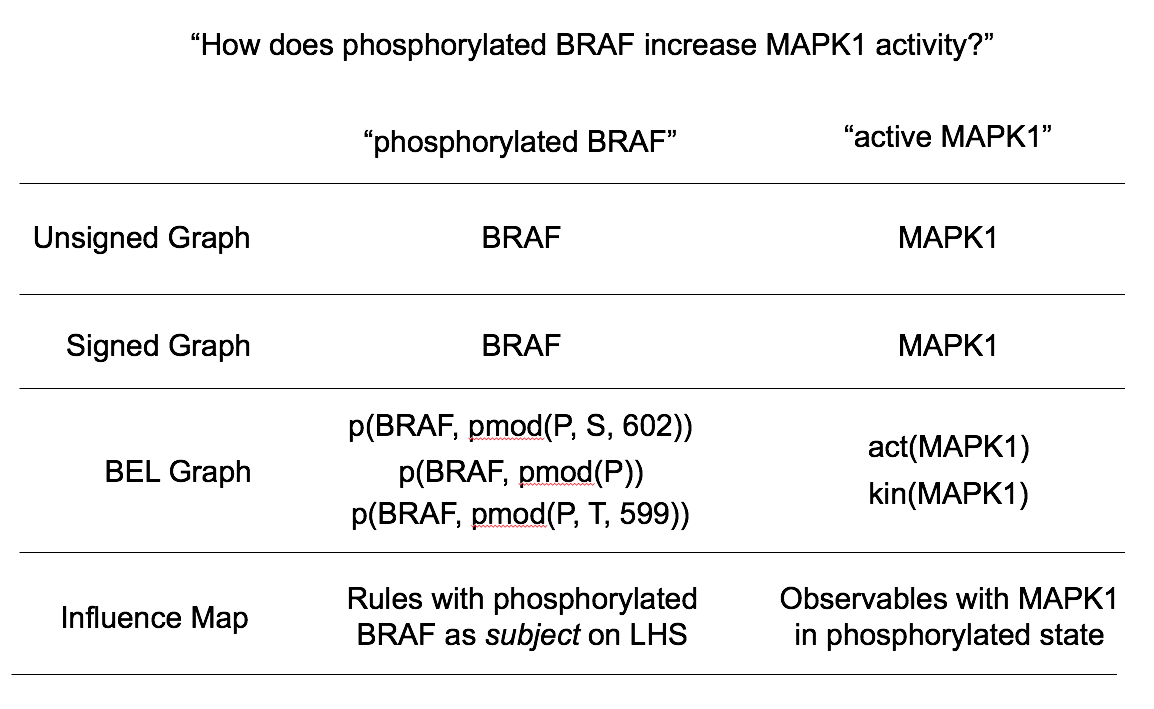
Figure 1: Network nodes associated with the subject and object of the causal query “How does phosphorylated BRAF increase MAPK1 activity?” using the four causal representations deployed in this reporting period.
In addition to generating the model testing results on the back end, the EMMAA web application now presents the results of multi-resolution model checking to the user. The Tests tab of the model landing page now highlights the proportion of passed tests for each model type (Figure 2). As expected, the least stringent causal representation (unsigned graph) generally yields the highest proportion of passing tests, while the most stringent (PySB) yields the lowest.
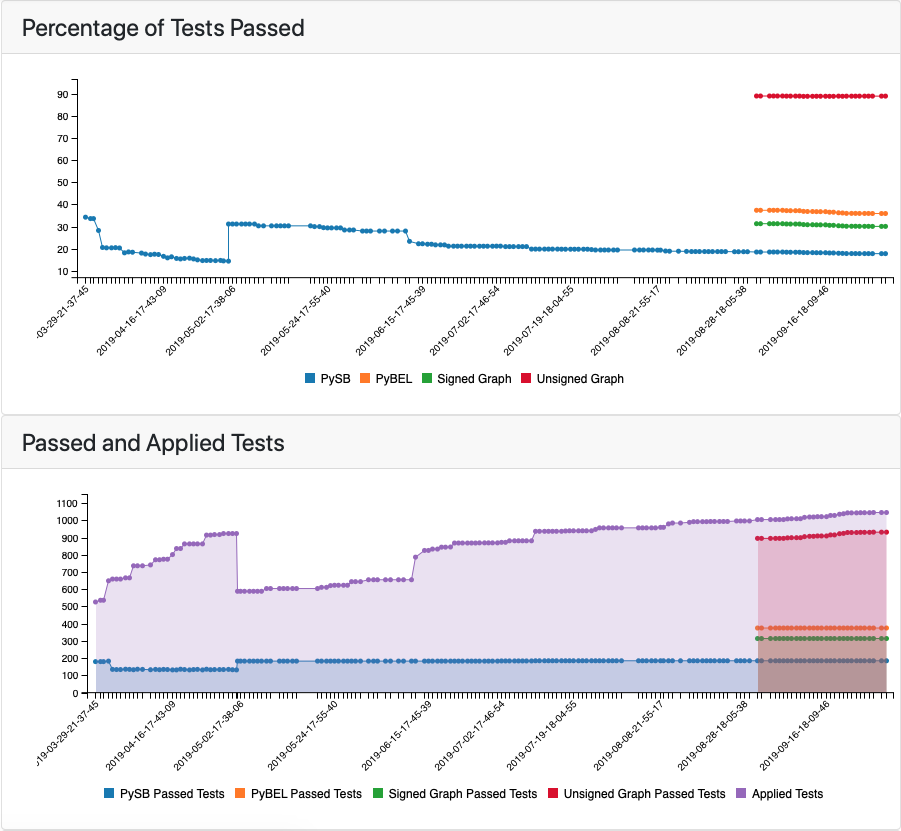
Figure 2: Test report graph highlighting the percentage of applied tests passed in each of the four causal representations.
In addition, the test report page now displays tests results as a matrix rather than a simple list (Figure 3). Each icon is hyperlinked to a test details page showing information about the test and the causal paths found to explain the causal query.
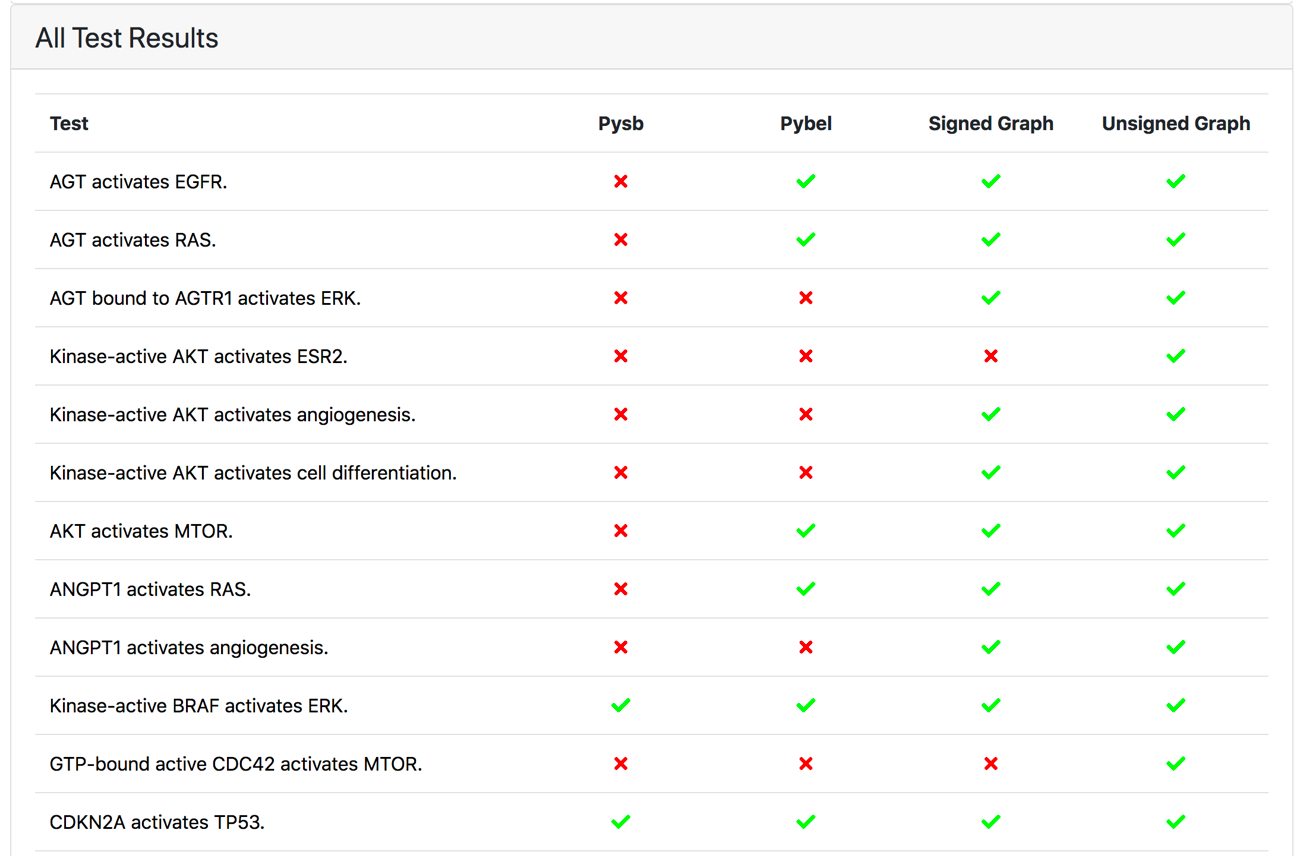
Figure 3: Test result matrix with the green and red icons indicating whether the given test passed or failed in the specific model representation, respectively.
User-specific query registration and subscription
We implemented a user registration and login feature in the EMMAA dashboard which allows registering and subscribing to user-specific queries. After registering an account and logging in, users can now subscribe to a query of their interest on the EMMAA Dashboard’s Queries page (https://emmaa.indra.bio/query). Queries submitted by users are stored in EMMAA’s database, and are executed daily with the latest version of the corresponding models. The results of the new analysis are then displayed for the user who subscribed to the query on the query page. This allows users to come back to the EMMAA website daily, and observe how updates to models result in new analysis results. Later, we are planning to report any relevant change to the analysis results directly to the user by sending a notification via email or Slack.
This capability is one important step towards achieving “push science” in which users are notified about relevant new discoveries if the inclusion of these discoveries result in meaningful changes in the context of prior knowledge (i.e., a model) with respect to a scientific question.
An improved food insecurity model
This month we migrated the food insecurity model to use the new World Modelers ontology (https://github.com/WorldModelers/Ontologies), and expanded its set of search terms. This significantly increased the models’ size and the granularity of concepts over which it represents causal influences:
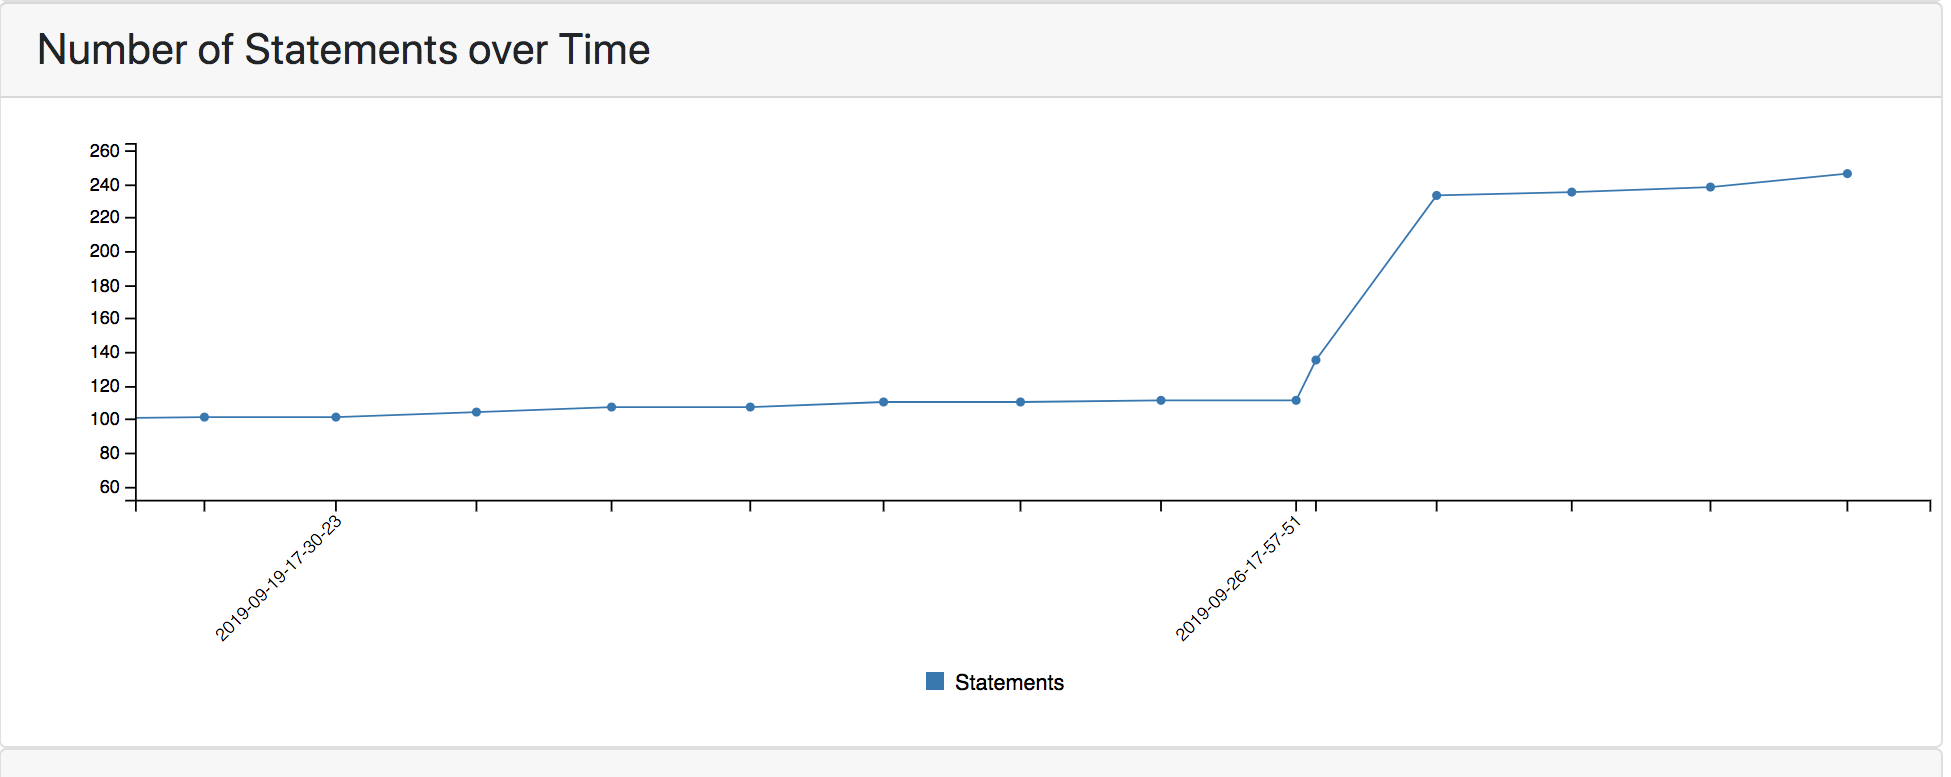
Figure 4: Size of the food insecurity model over time.
Below is a snapshot of the network view of the model on NDEx (https://ndexbio.org/#/network/478a3ed6-b3b7-11e9-8bb4-0ac135e8bacf):
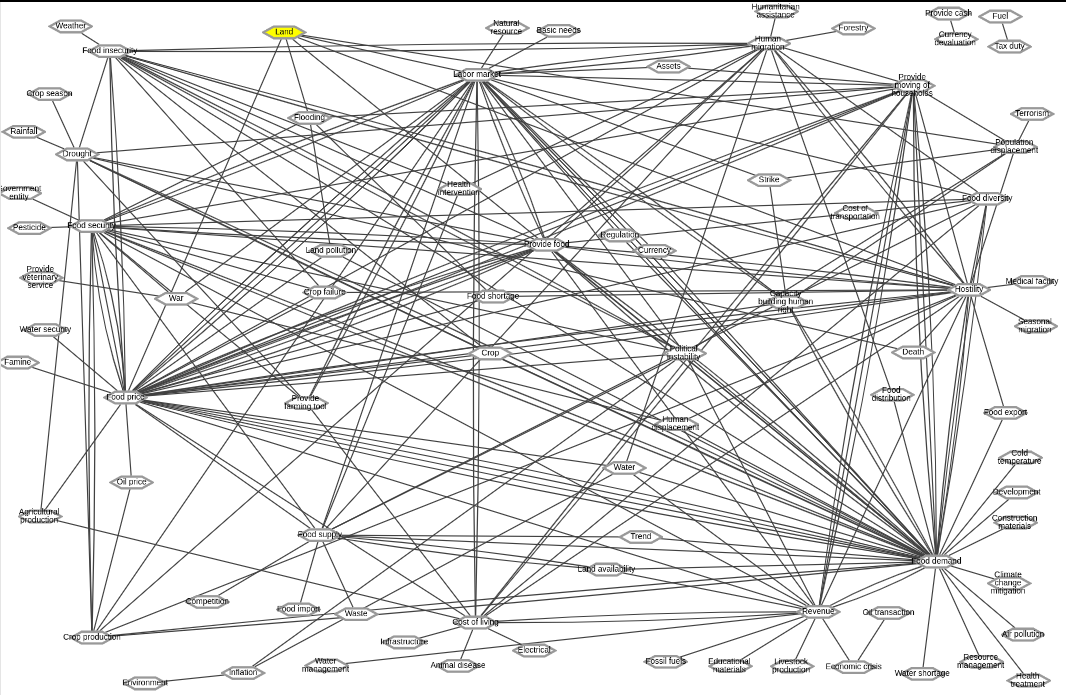
Figure 5: Snapshot of the food insecurity model as of 9/27/2019.