EMMAA Models Page
The models page contains detailed information about the selected model in the following tabs:
Each tab has a section describing its content. At the top of the page the selected model is shown in a drop-down menu. Another model can also be selected and loaded from the menu.
Avaliable tabs
Link to statement details
Multiple tabs display the model statements descibing relevant biological mechanisms. To see further details regarding a mechanism, browse its evidence from literature and databases and submit curations, links to a separate page are generated for all statements where possible. To read more about that page, see: EMMAA Statement Evidence Page.
Link to statement evidence page
Model Overview Tab
This tab contains information and statistics about the model and the statements it is built from. At the top of the tab a user can find model description, the date when it was last updated and the date when the displayed state of the model was generated. By default the latest available state of the model is displayed but the user has an option to explore earlier states by clicking on an earlier time point on any of the time plots across the tabs (for more details see: Load Previous State of Model). Links to the NDEx website where a network view of the model can be examined and to the Twitter account if available are provided. There are also two buttons in the top right corner of the first table: - “Subscribe” (might need to log in to see) that lets users subscribe to receive email notifications when the model has any updates. - “Chat” that opens up a dialogue window where users can chat with the model in natural language. Read more about this here: Chat with the model
It is possible to download the models in various formats and the corresponding buttons are placed next.
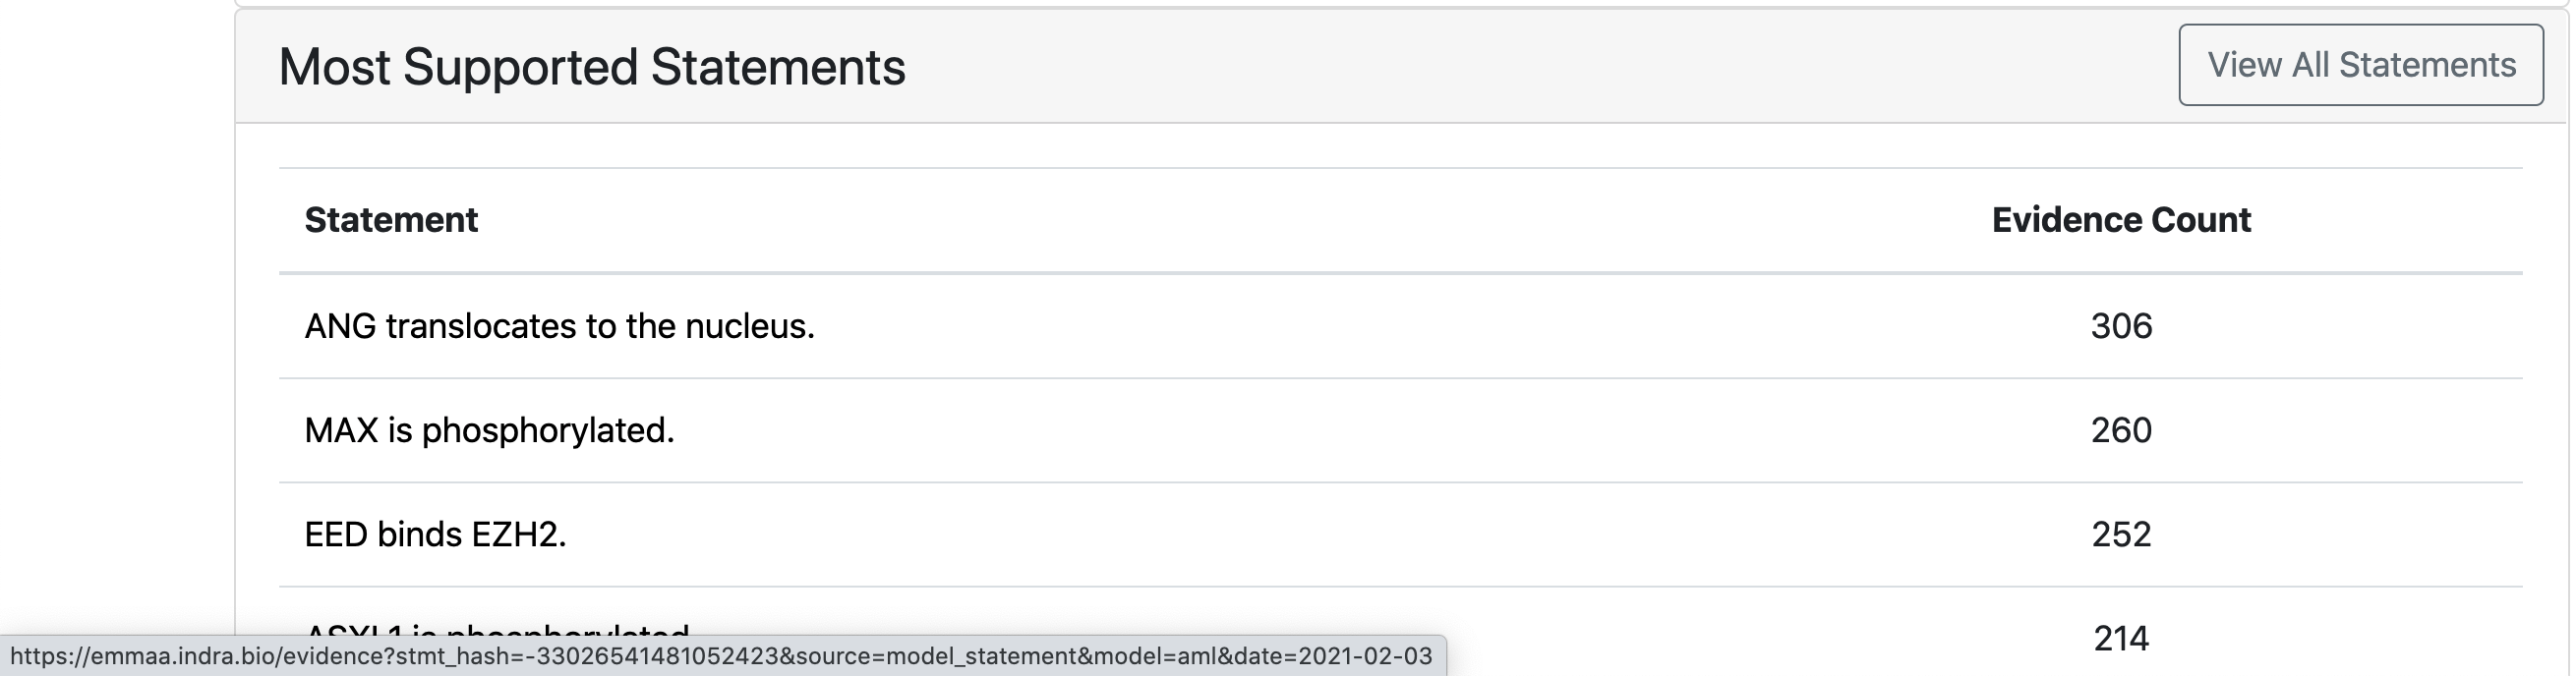
The page also displays properties of the current state of the model, namely, the distribution of statement types, the top 10 agents in the model, the distribution of knowledge sources (reading systems and databases) of model statements and the statements with the most support from various knowledge bases. The table with most supported statements also has a button “All statements” clicking on which a user can be redirected to a page showing all statements in the model: EMMAA All Statements Page. It is also possible to get redirected to all statements page by clicking on any statement type in “Statement Types Distribution” plot (the statements will be filtered to this type in this case). Further, the page shows how the number of statements in the model has evolved over time, and which statements were added to the model during the most recent update.
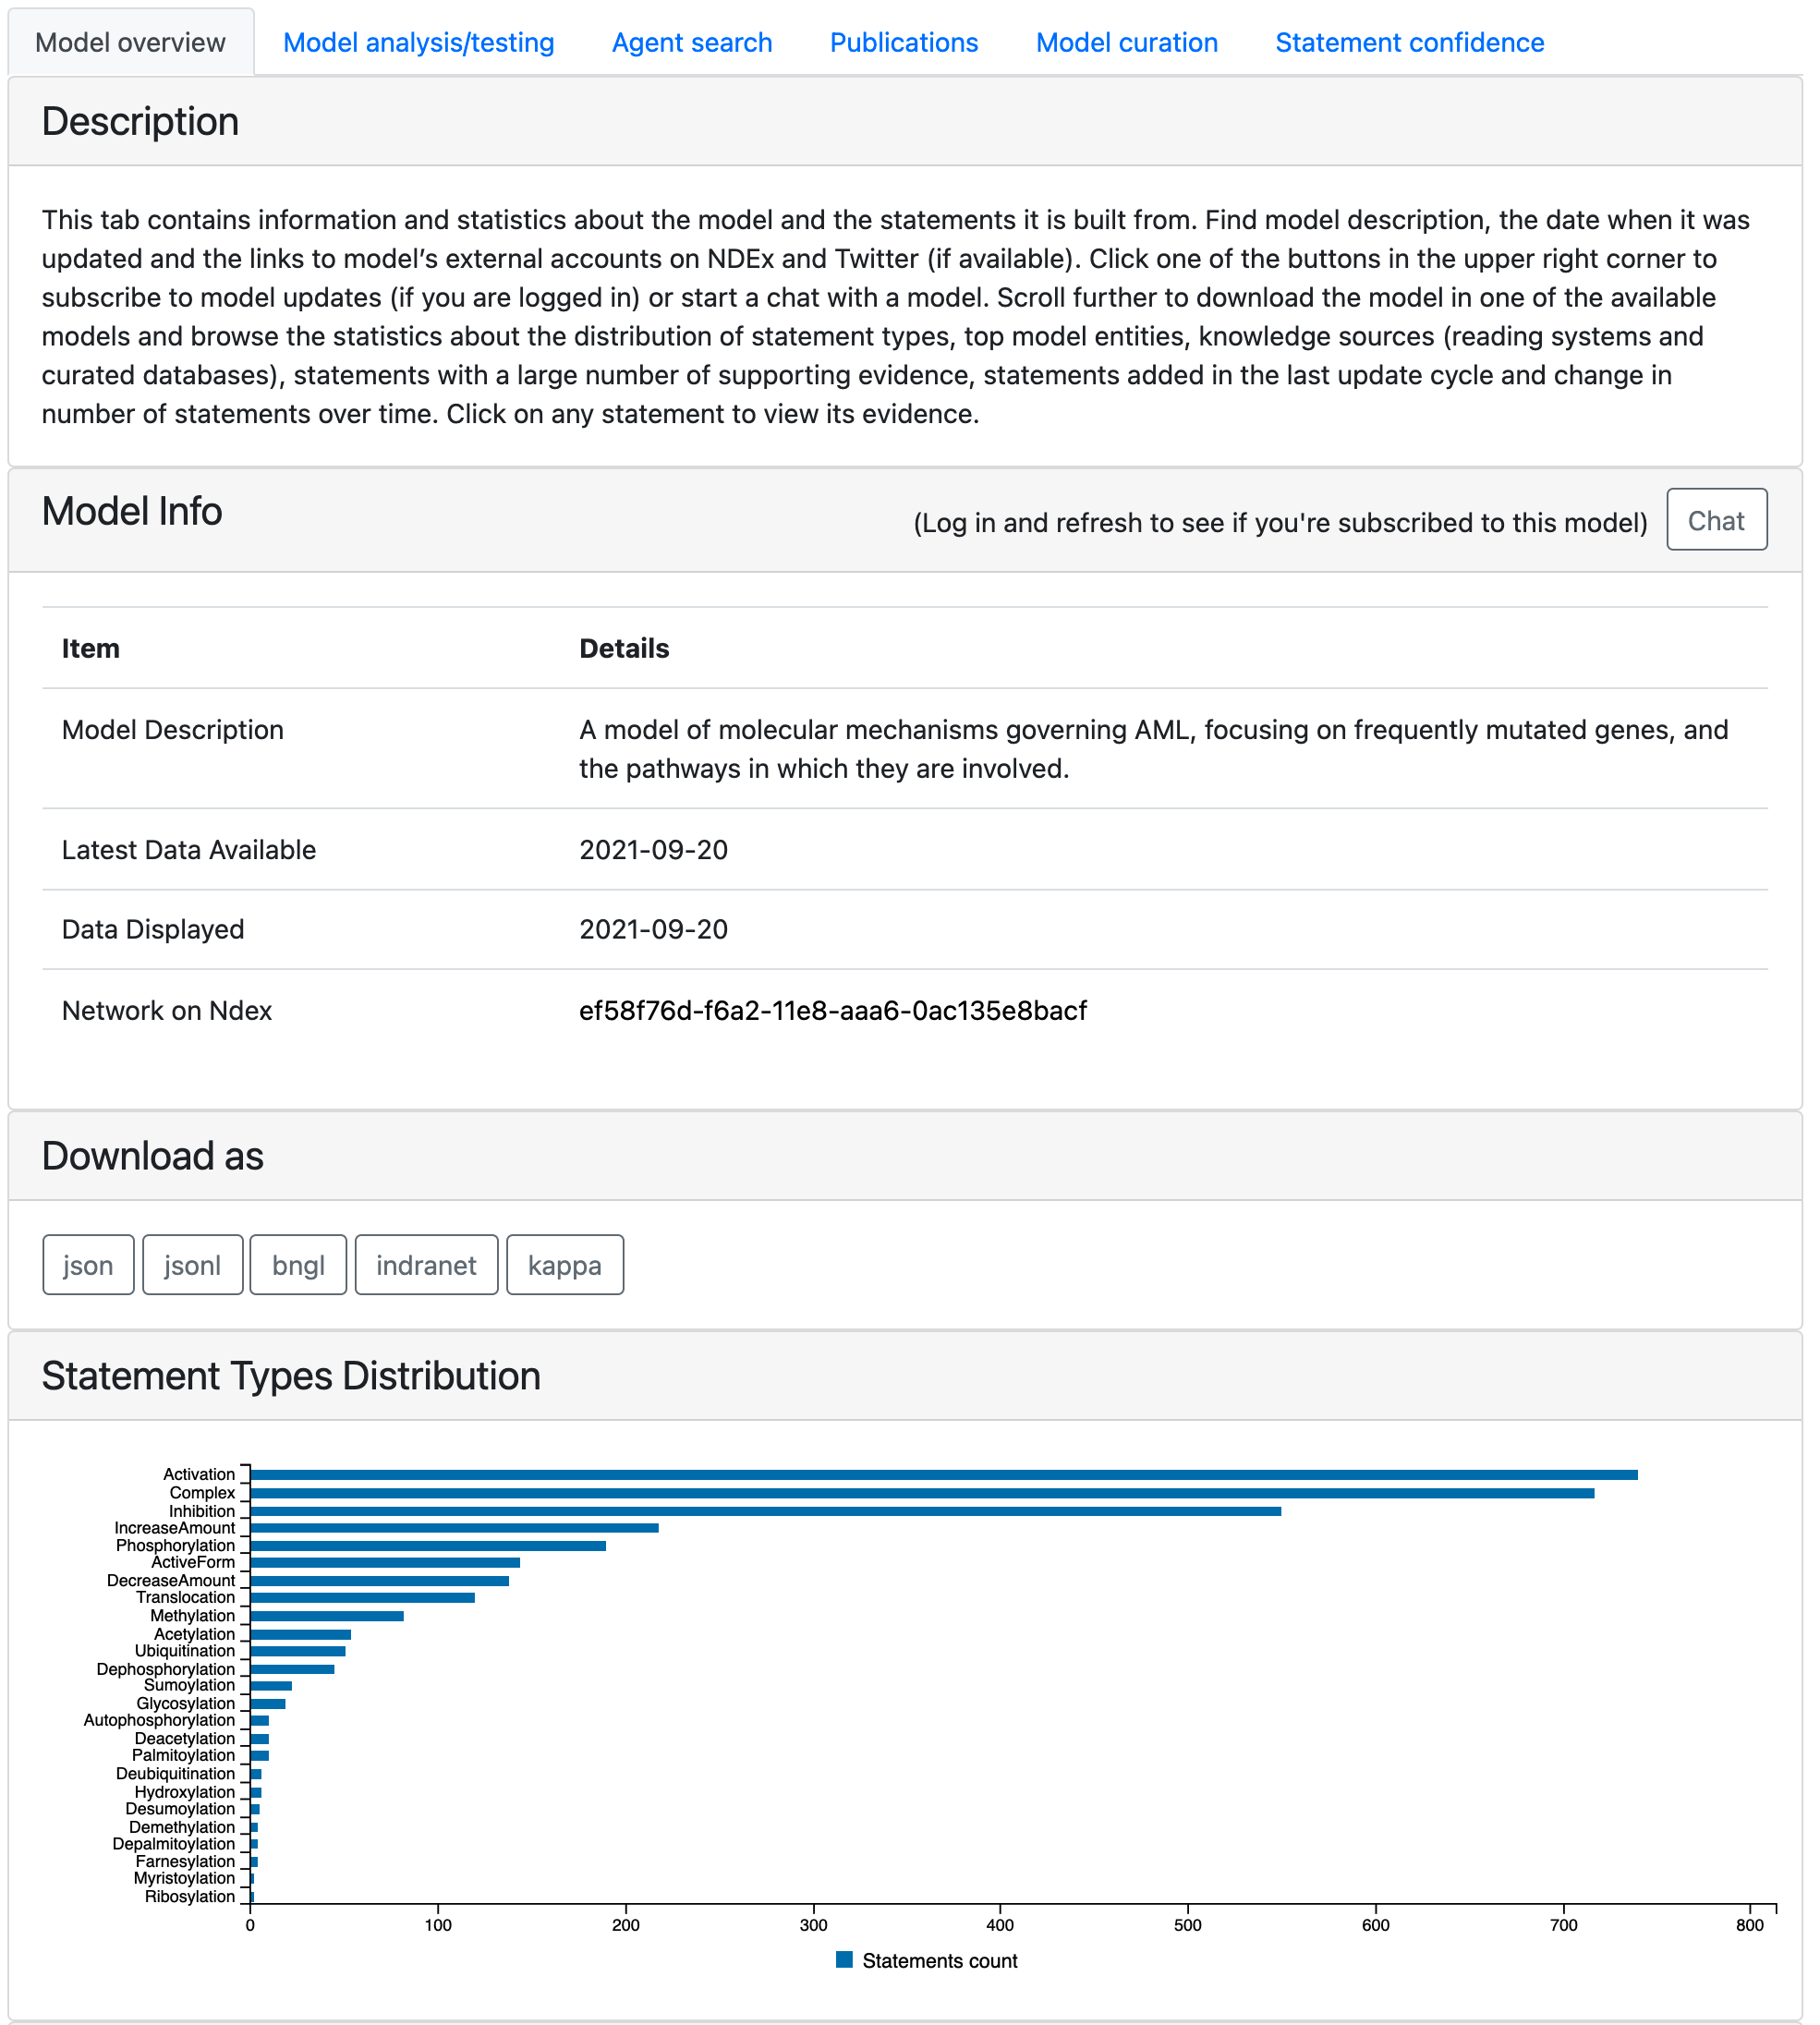
The top of the model tab
Model Analysis/Testing Tab
The model analysis/testing tab contains information about the results of using the model on a selected “test” corpus. Test corpora consist of Statements representing observations. These can either be considered properties that the model is expected to satisfy (model validation or testing) or unexplained data that model analysis is used to explain (model analysis). At the top of the model analysis/testing tab, a drop down menu displays which test corpus was used for the currently displayed test results. Clicking on the drop down menu will display all available test corpora for the current model. Clicking “Load Test Results” will load the test results for the selected test corpus.
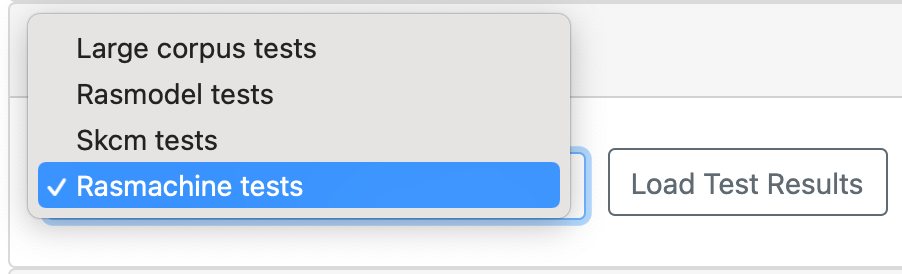
The results from different test corpora can be loaded. Here “Rasmodel Tests”, “Skcm tests”, “Rasmachine Tests”, and “Large Corpus Tests” are available.
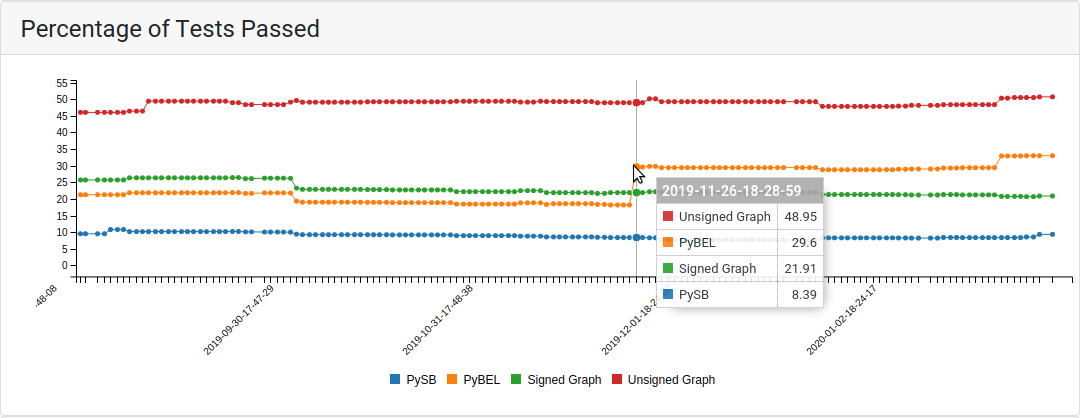
The analysis/testing tab contains two related plots: one showing the evolution over time of the percentage of applicable tests that passed, and another showing the absolute number of tests that were applied to the model and the number of tests that passed in each of supported model types. For the first few months of the project, the tests were only run on a PySB model assembled from EMMAA model statements. Later three additional model types were added, namely, PyBEL graph, signed directed graph and unsigned directed graph.
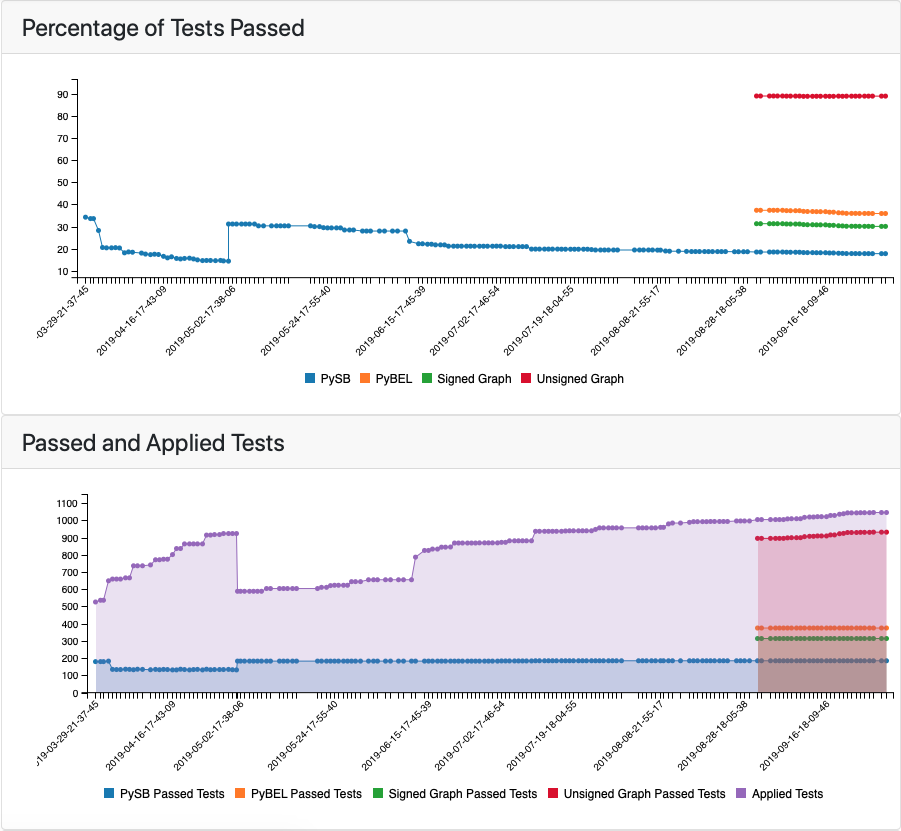
The top of the tests tab showing the percentage of tests passed together with applied and passed tests in different model types
If any new tests were applied in the latest test run of the model they are shown under New Applied Tests. A green check mark is shown for tests that passed and a red cross is shown for the tests that did not. The marks can be clicked on and link to a detailed test results page where the detailed path(s) or a reason for the model not having passed the test will be shown. To read more about the detailed test results page, see: EMMAA Detailed Test or Query Results.
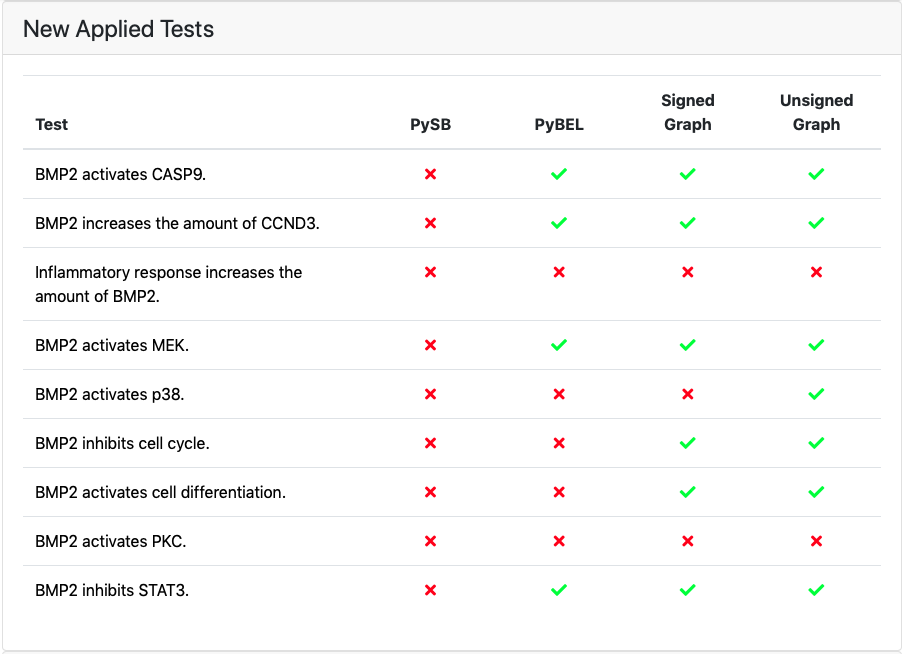
If new tests were applied, they will be shown together with a breakdown of a test status per each model type
New tests that passed for any of the model types are shown under New Passed Tests along with the top path found. The statements supporting the path are can be seen by clicking on a path which links out to the detailed test results page for the test.
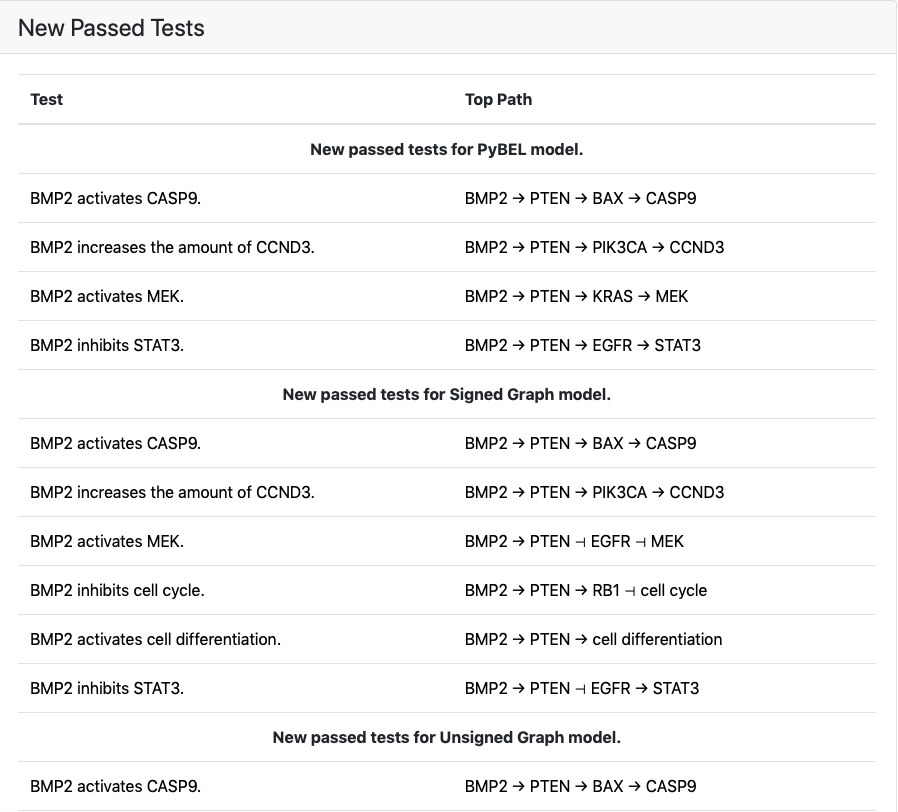
If new tests were passed, they will be shown together with a top path
Further down, all tests applied to the model are shown. Similarly to new applied tests, this table also contains green and red marks indicating the test status, linking to detailed test results page.
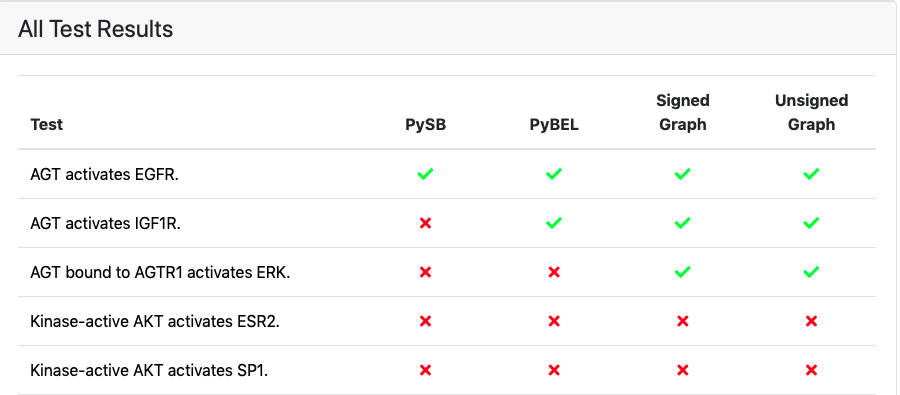
Part of the list showing all applied tests with a status indicator for passed/failed
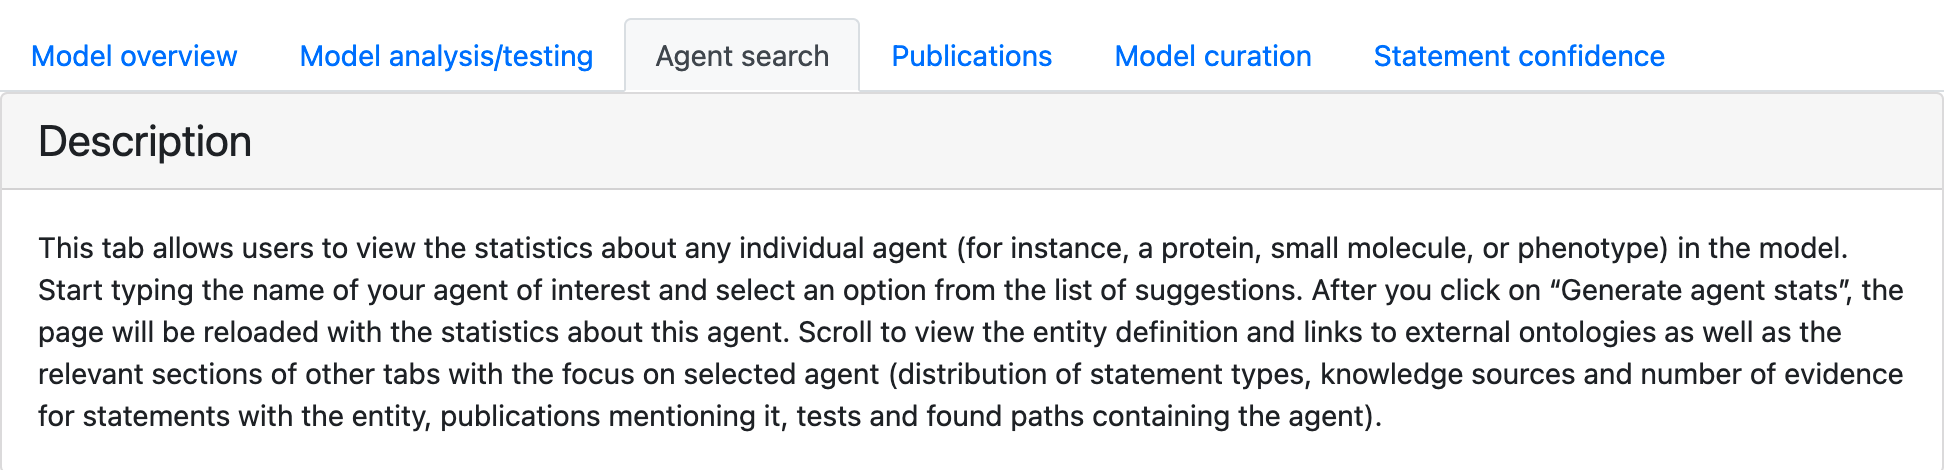
Agent Search Tab
The Agent Search tab allows users to view the statistics about any individual agent (for instance, a protein, small molecule, or phenotype) in the model. To initiate the search, a user needs to type the name of the entity of interest (or select one from suggested options) and click “Generate agent stats” button. The page will be reloaded with the statistics about this agent.
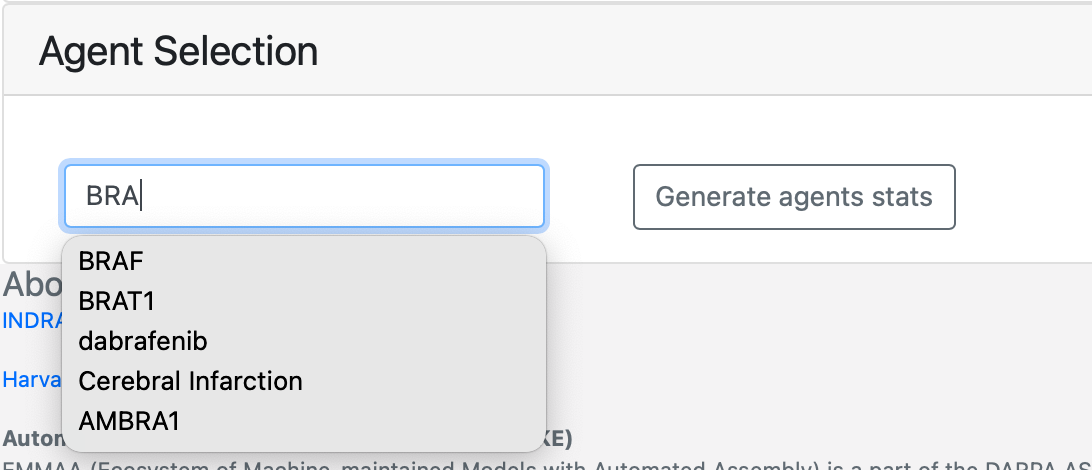
Suggestions for the partially typed agent name
The newly generated page contains the agent description and links to external ontologies as well as the relevant sections of other tabs with the focus on selected agent. Similarly to model overview tab, it displays the distribution of statement types, knowledge sources and most supported statements but only statements containing the selected agent are used to generate this statistics. The tab also shows top interactors of the entity in the model and publications from which the statements containing it were extracted.
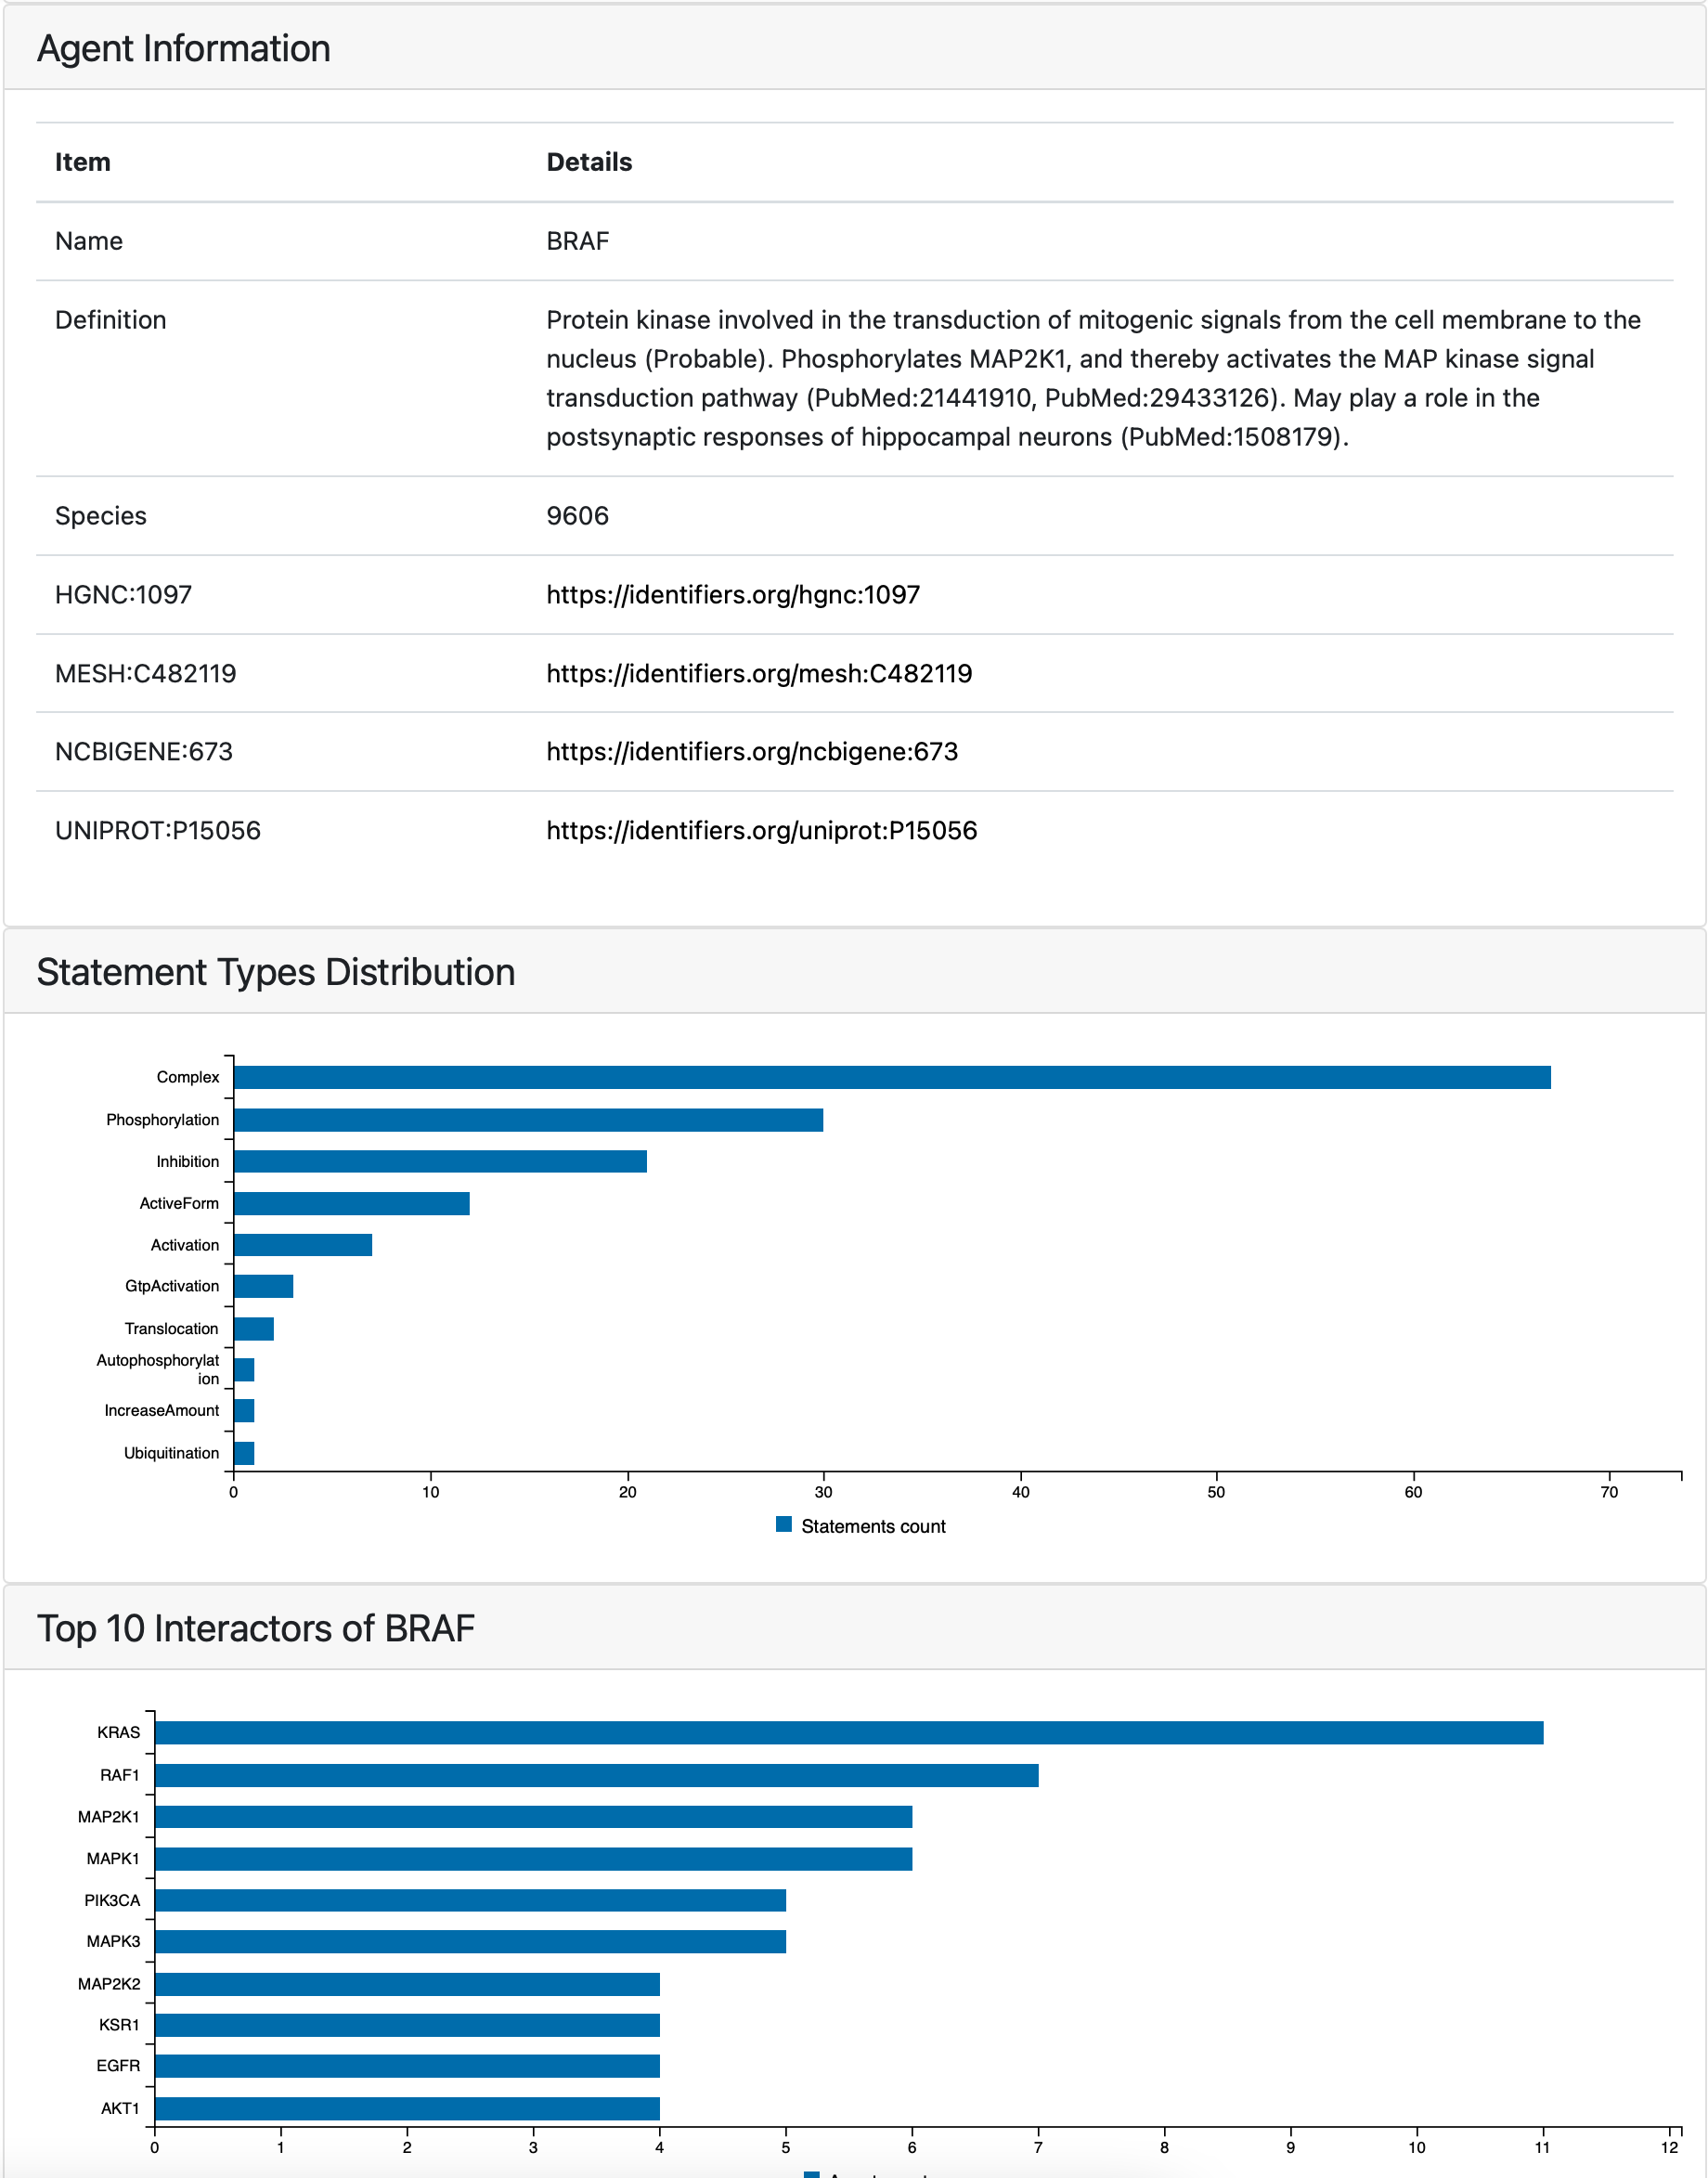
Part of the page generated for BRAF
Similarly to model analysis tab it contains the results of testing the model against a given test corpus. It is possible to select a different corpus to reload the results. There are two different aspects displayed here: 1) the observations (“tests”) that contain the agent of interest and their explanations 2) explanations (paths) containing the agent of interest.
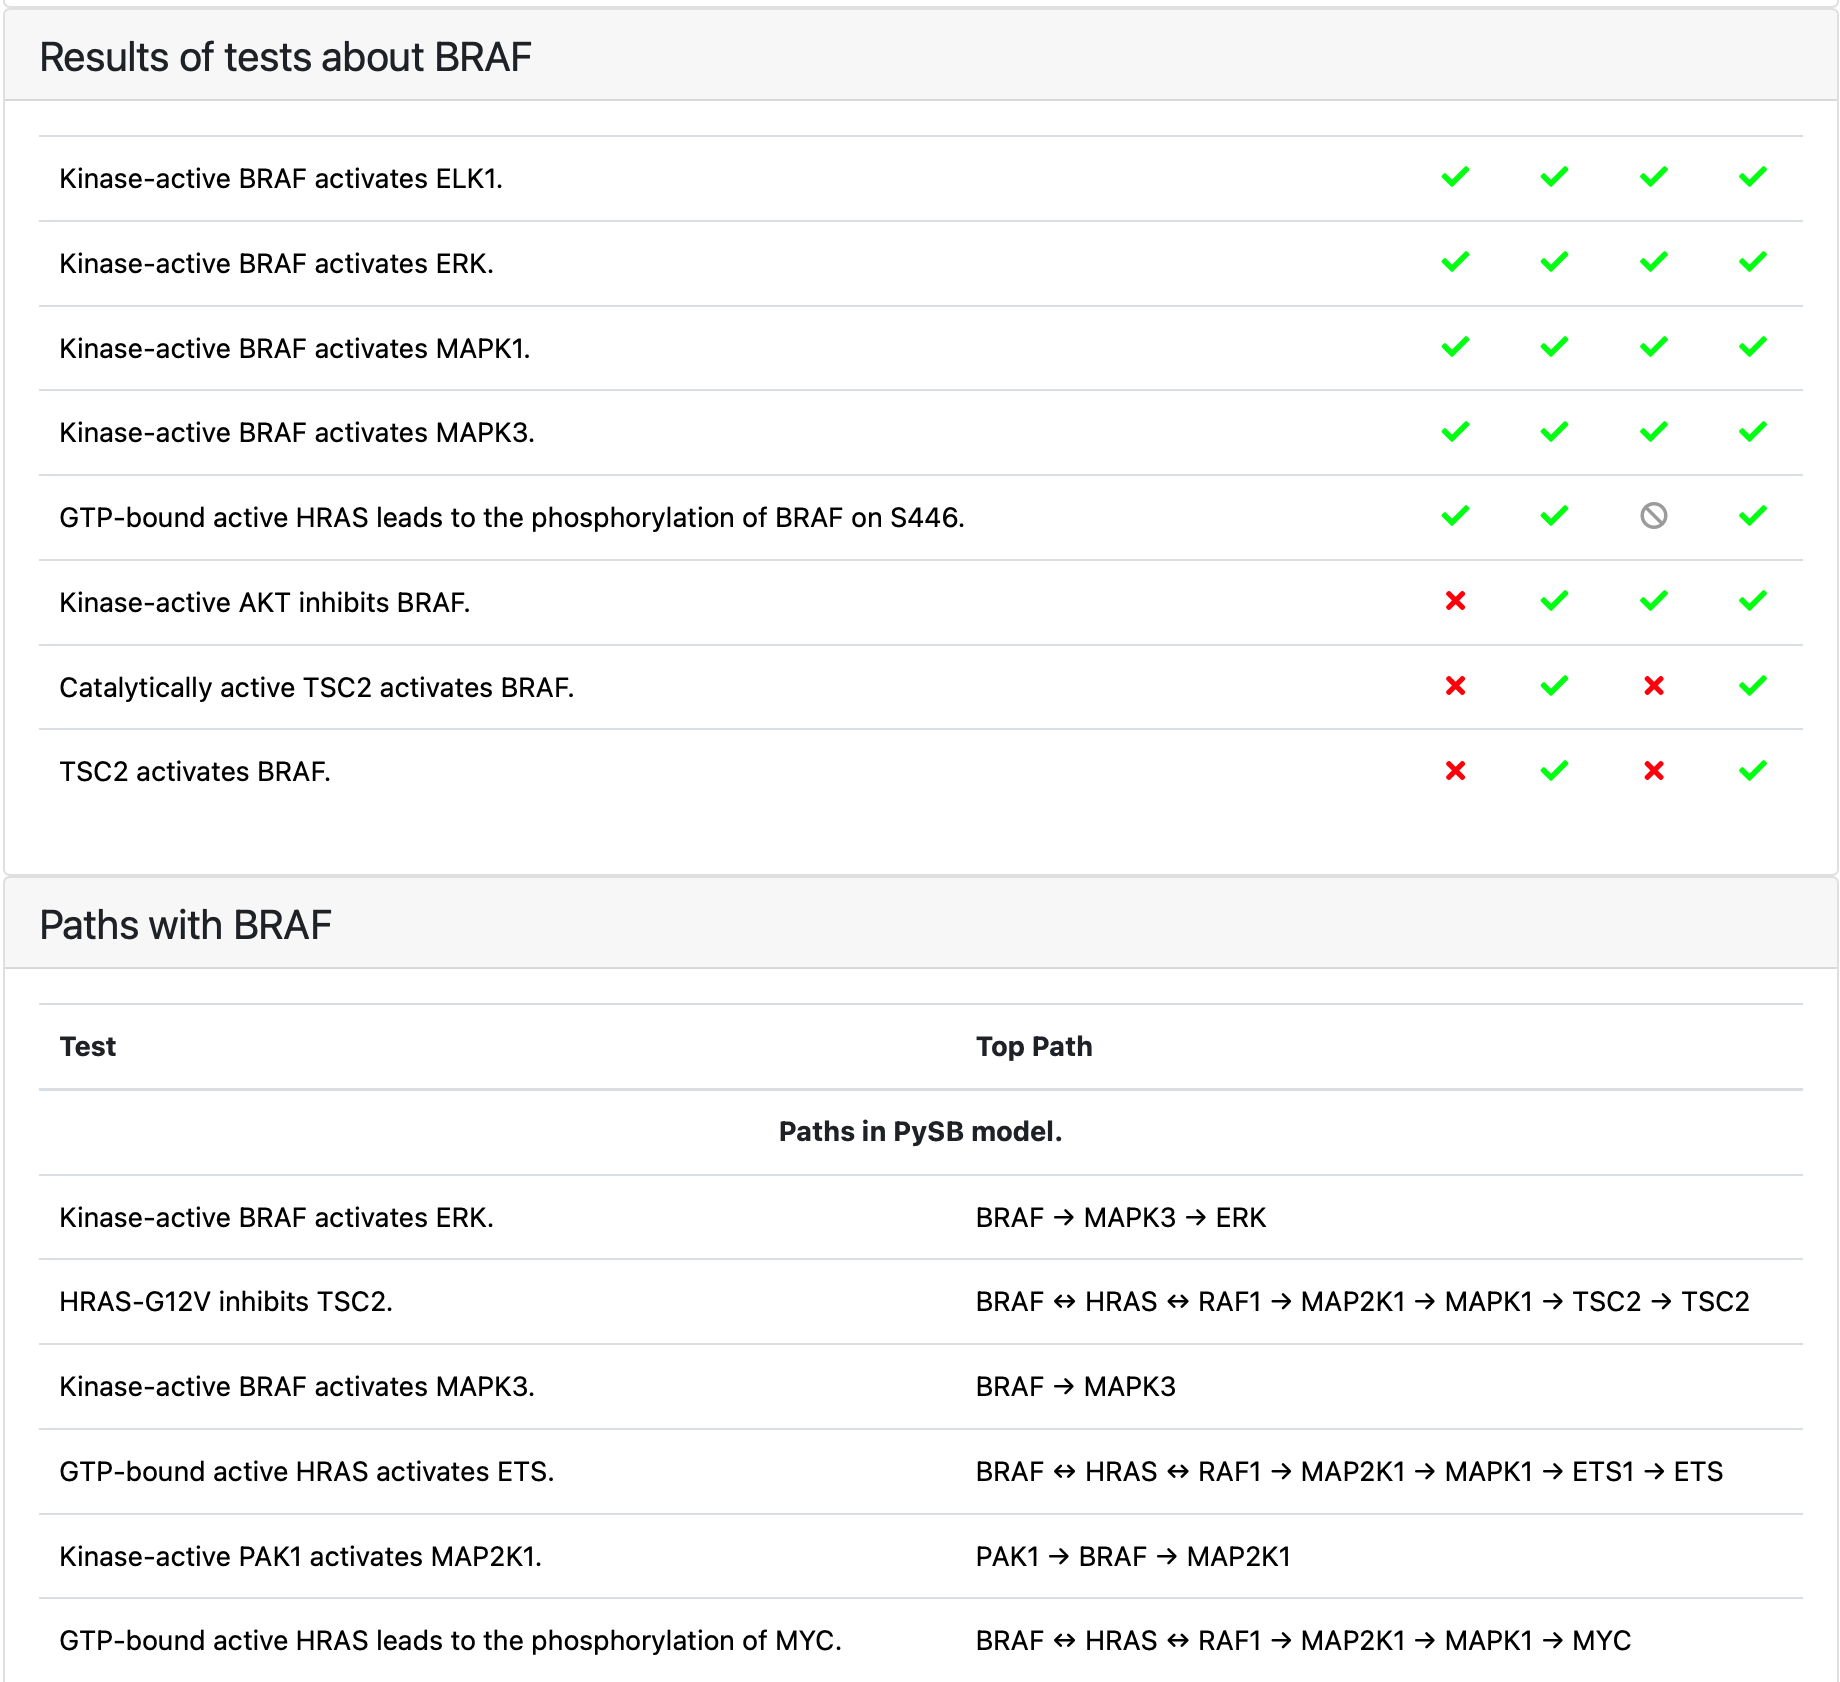
Tests and paths containing BRAF
Publications Tab
The Publications tab shows statistics for both processed papers and papers that support assembled model statements. At the top of the Publications tab the time series plot shows the changes in the counts of both paper groups over time.
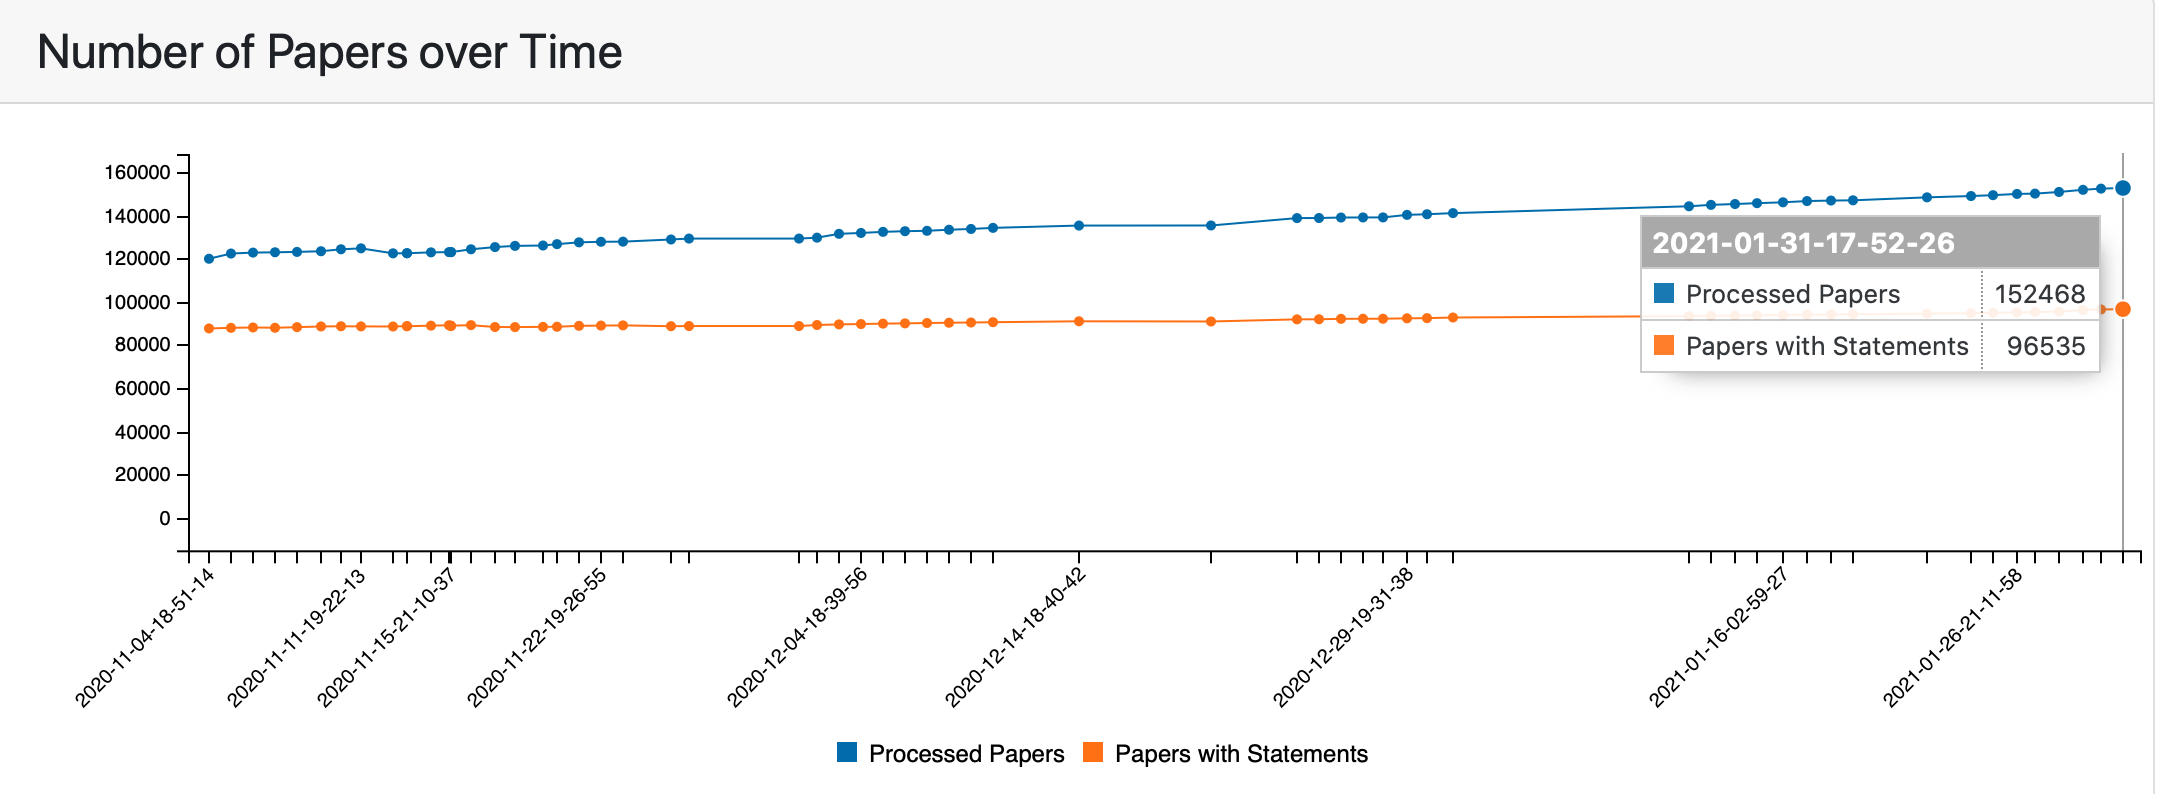
Number of processed papers and papers with assembled model statements over time
Further down, papers with the largest number of assembled statements are shown. The statements extracted for each paper can be viewed by clicking on a paper title (see: EMMAA Individual Paper Page).
Finally, a list of papers processed after the previos update is displayed. The table is sorted first by the number of assembled statements and then by the number of raw statements extracted from the paper. One or both of these numbers can be zero. Zero assembled statements with a positive number of raw statements means that the raw statements were filtered from the model during the assembly process. Two zeros mean that the paper was processed but no statements were extracted from it. The second column in this table provides a link to the original publication as an external resource.

Example of new processed papers table
Model Curation Tab
The Model Curation tab summarizes statistics related to curations for statements that are part of the model. At the top of the tab two barplots show the counts of evidences and assembled statements curated by individual curators.
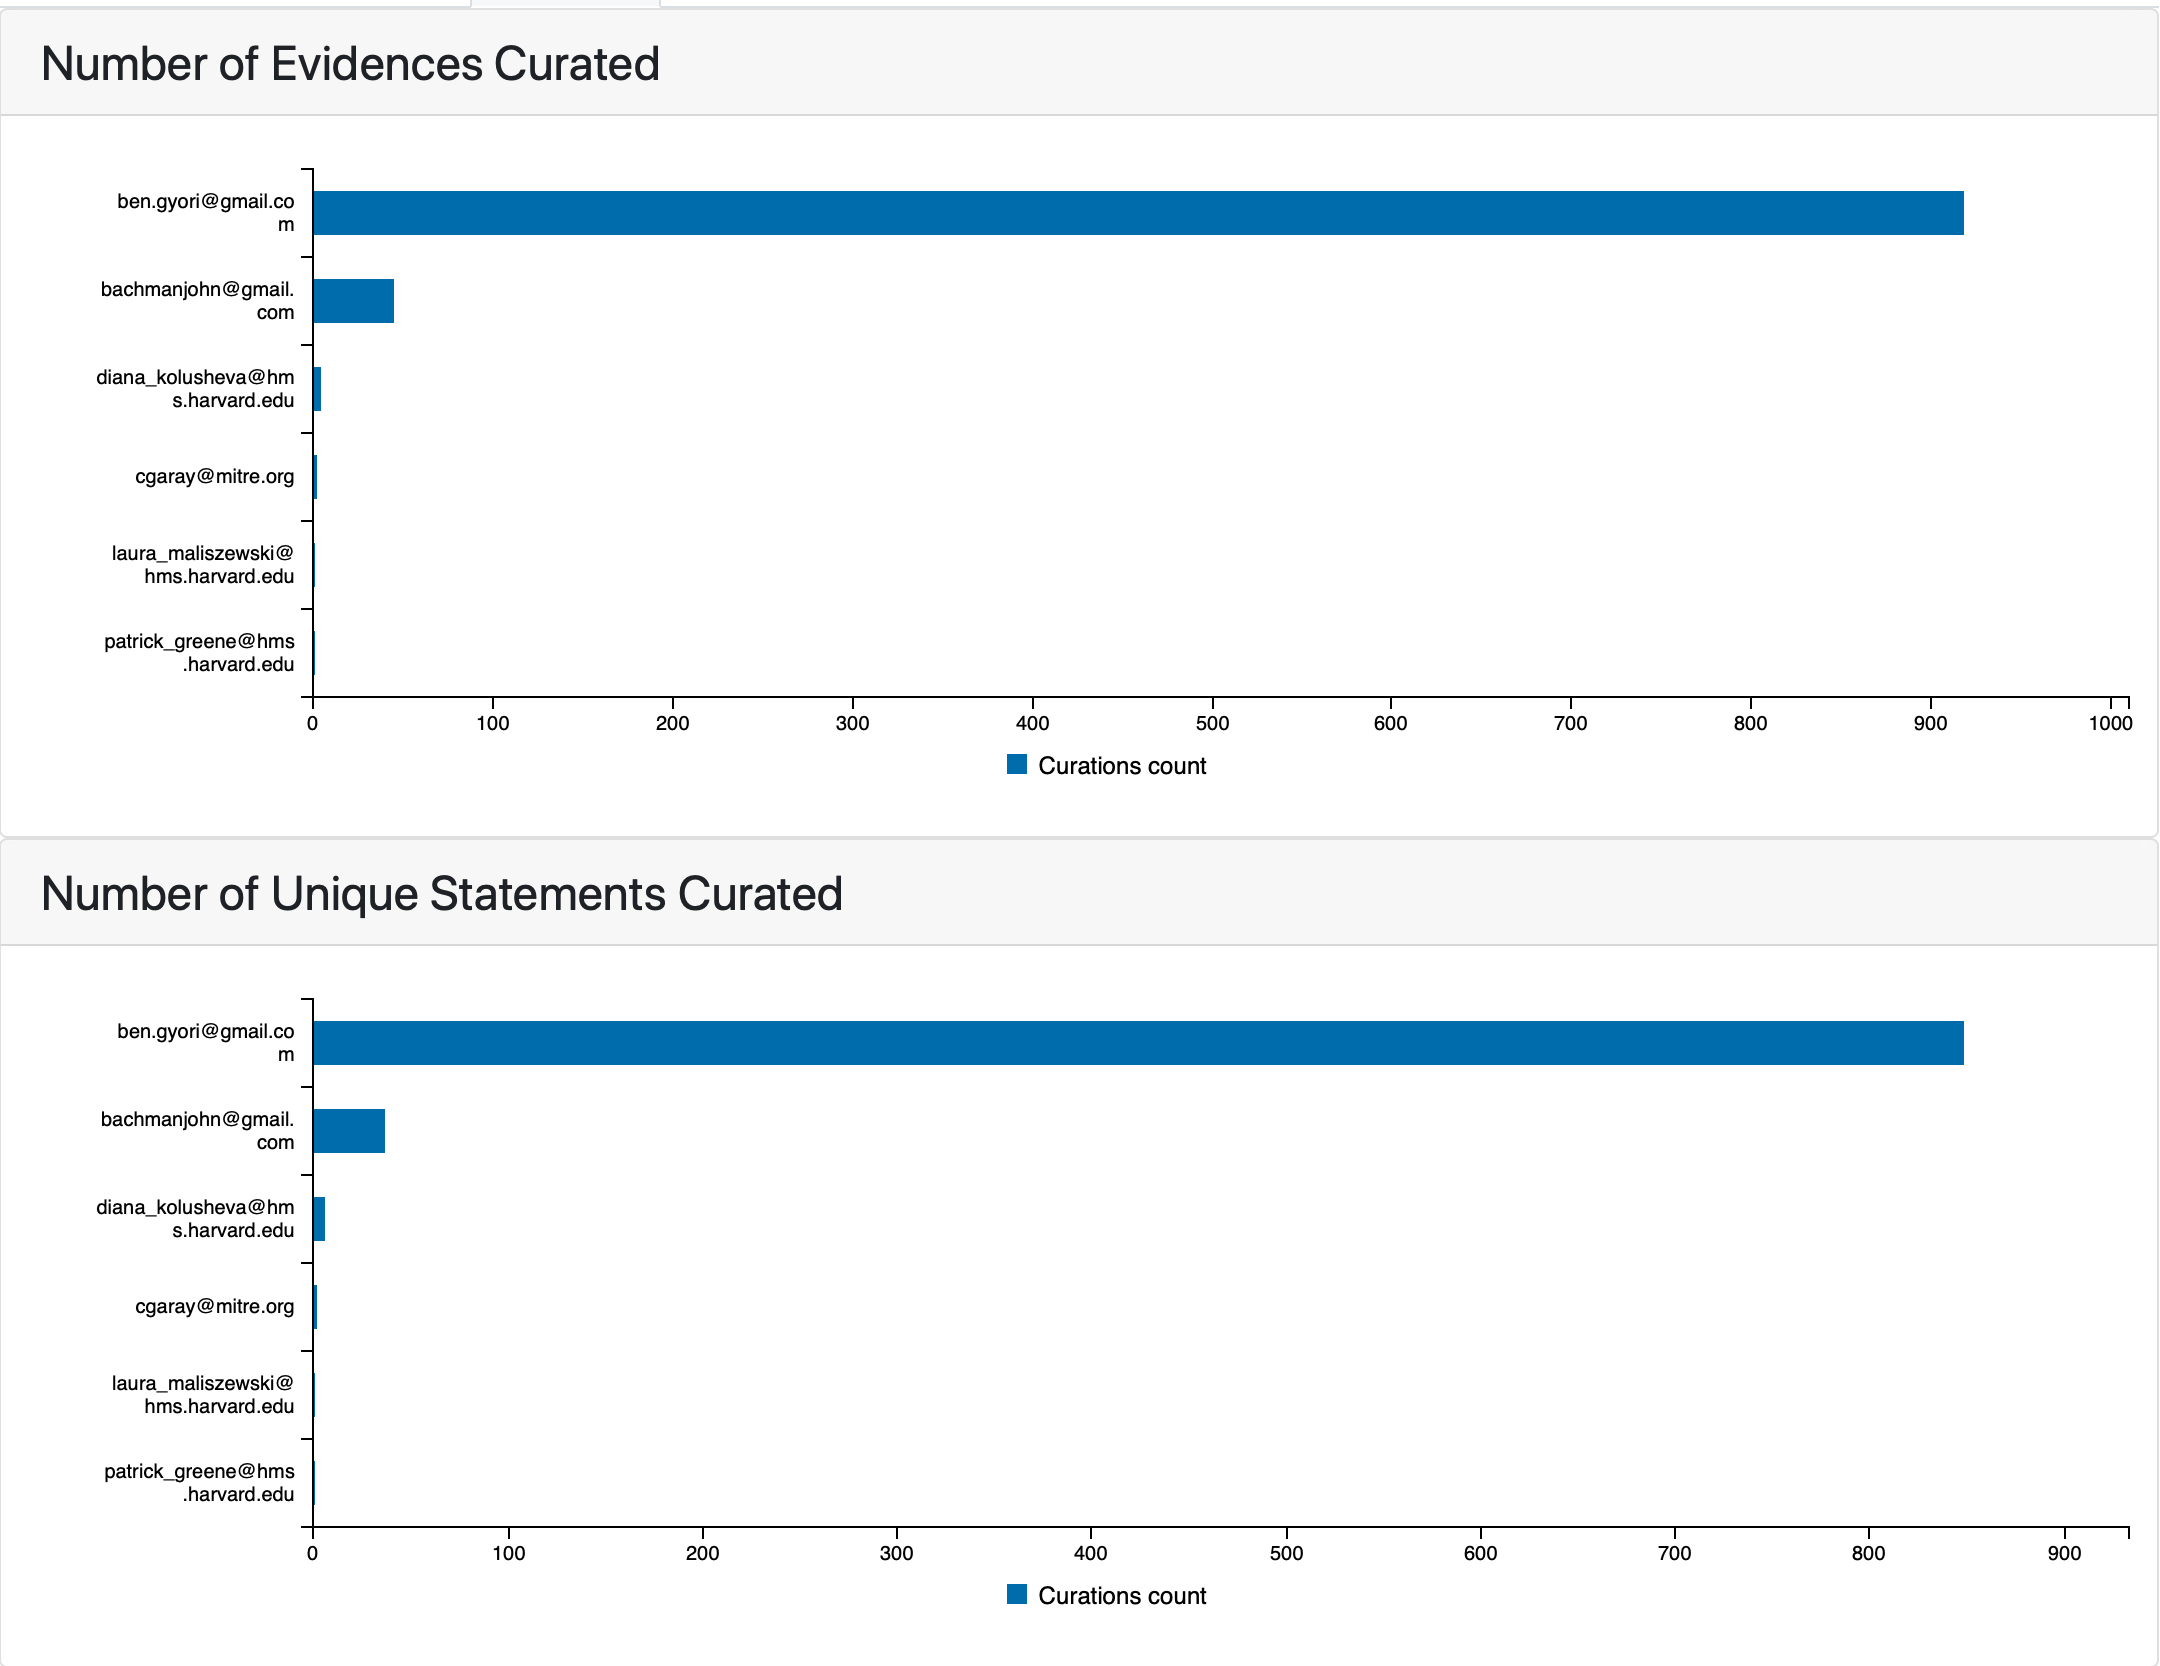
Counts of evidences and statements curated by individual curators
The next plot shows the number of curations grouped by type.

Curations grouped by type
Finally, the number of curated statements and evidences over time is shown.
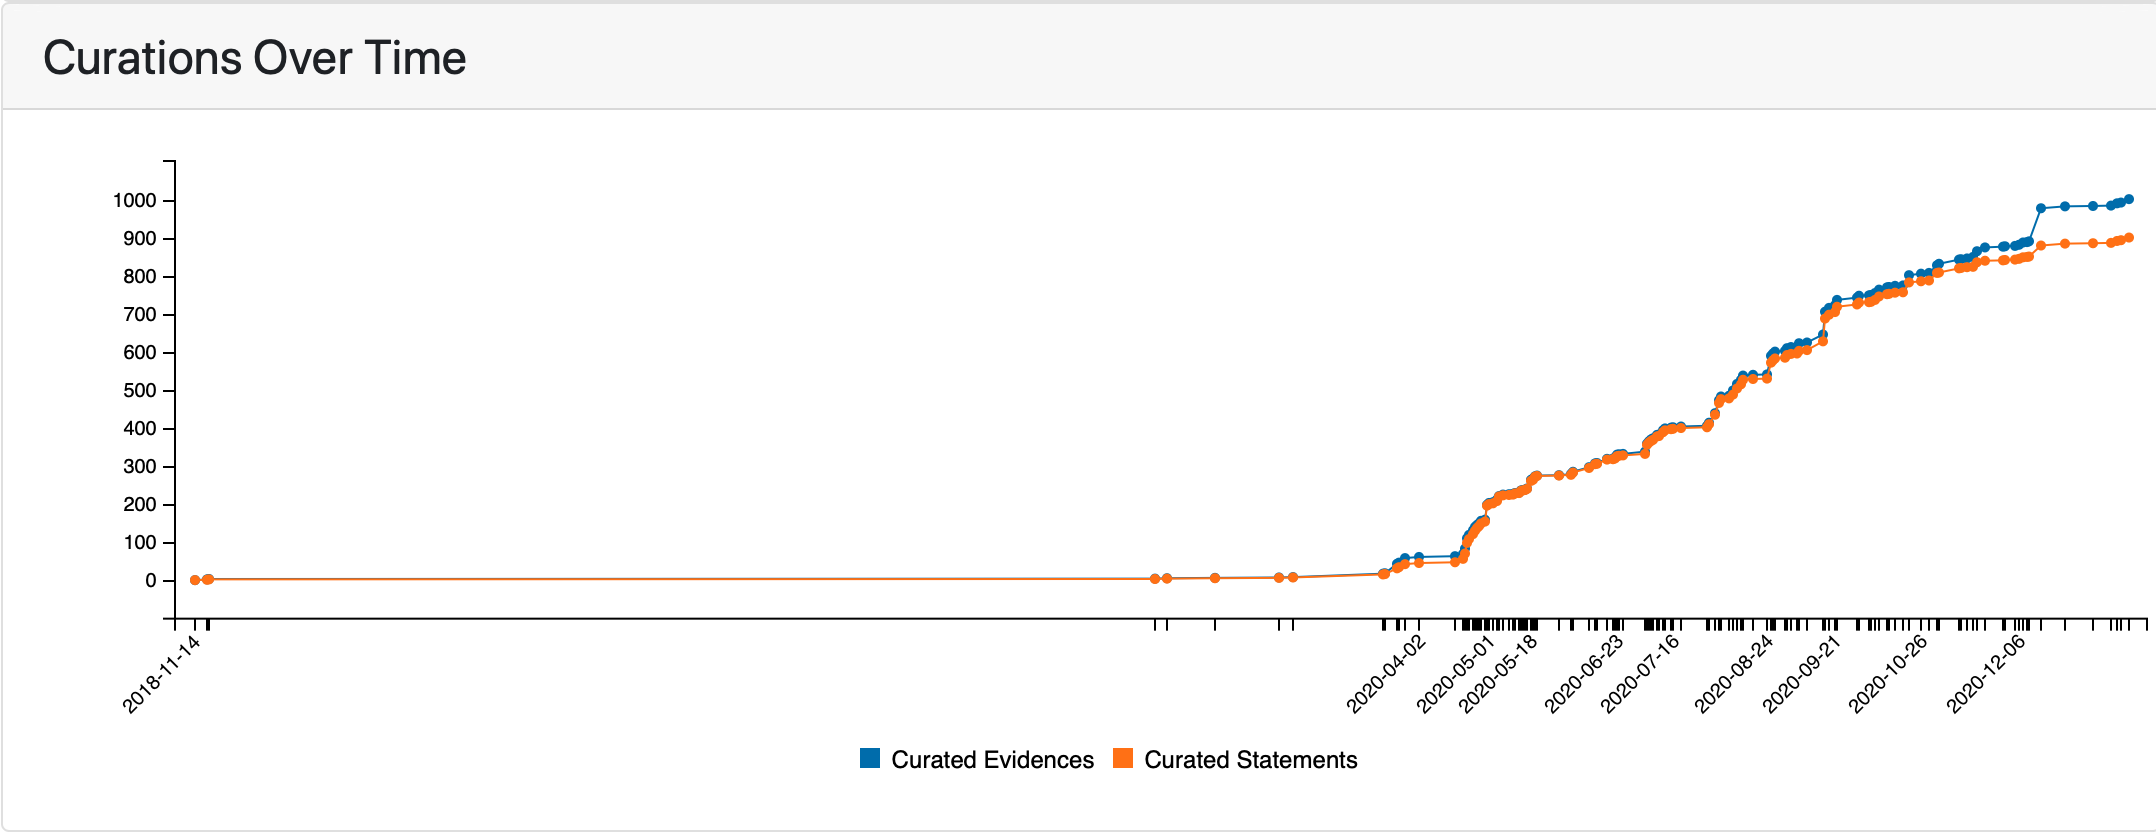
Curations over time
Statement Confidence Tab
Each statement in the model has an associated belief which represents the confidence level that the statement is correct. This tab shows the distribution of beliefs among statements in the model and allows users to select a belief range to view the statements within it.
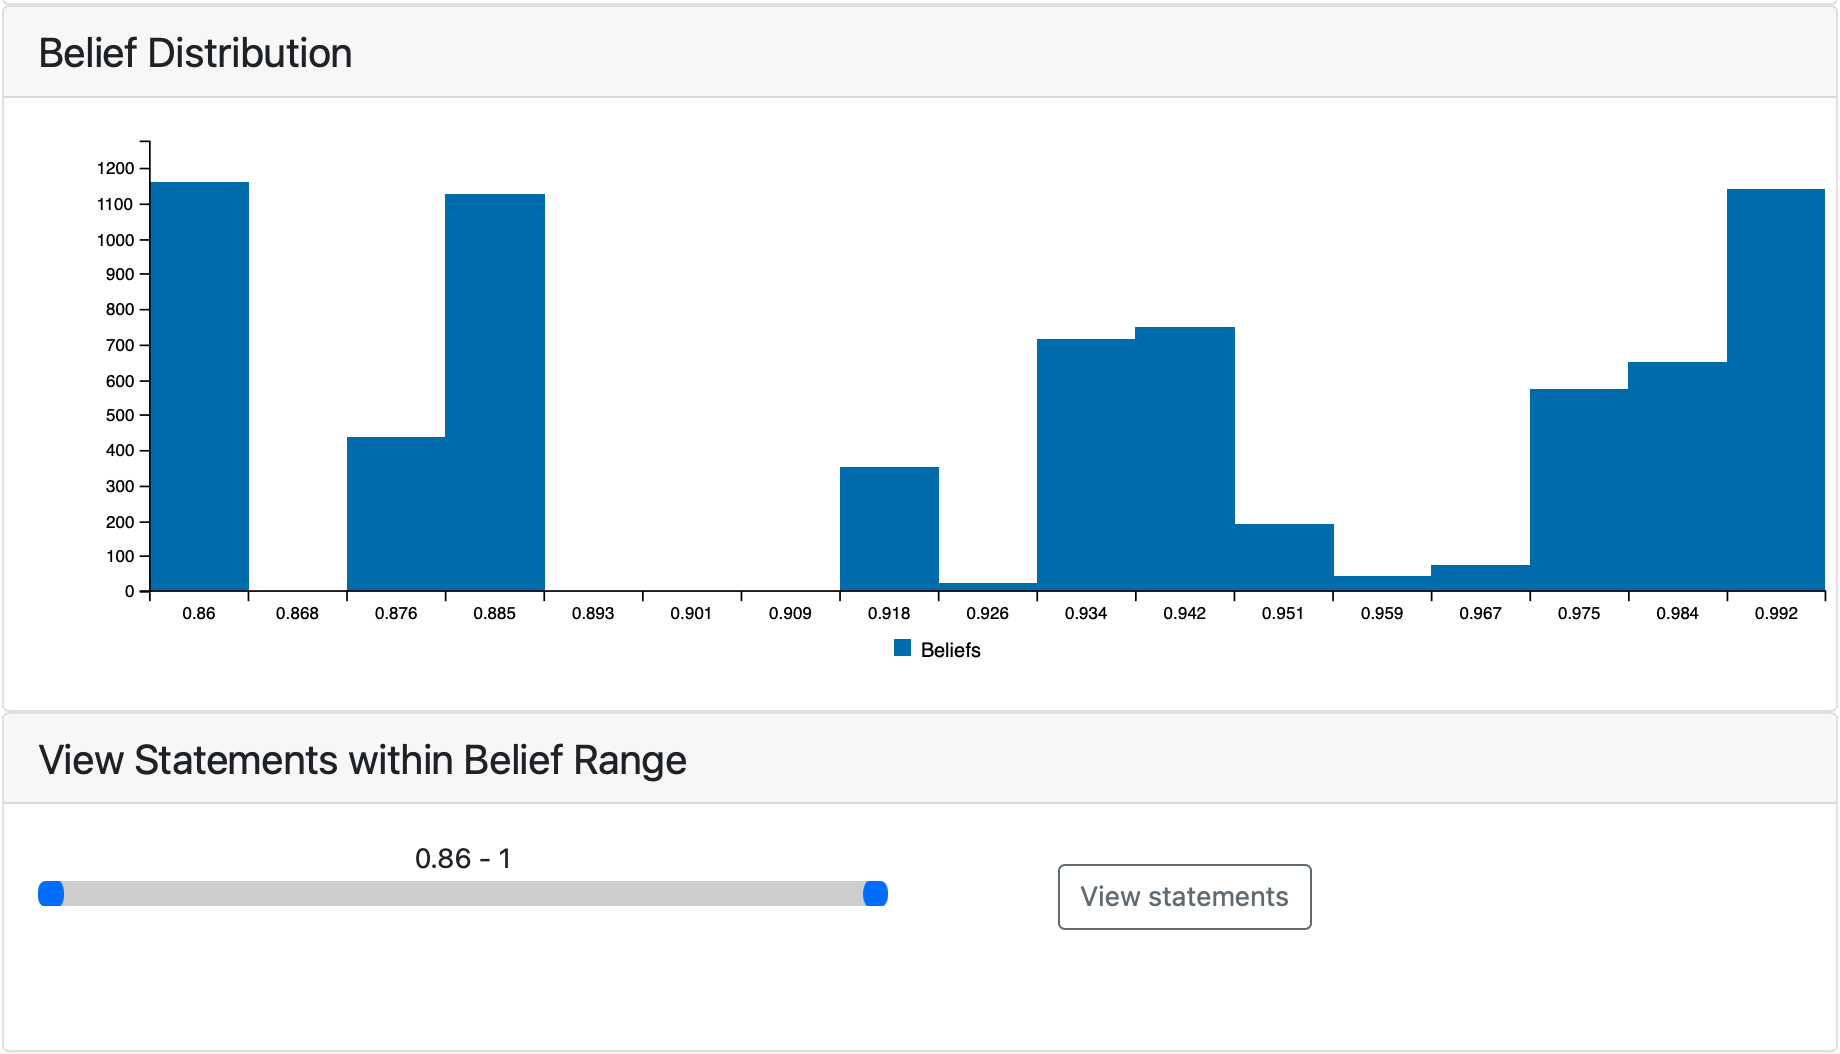
Statement Confidence tab
Load Previous State of Model
To view the state of the selected model together with the test results for a particualar date, click on any data point for the desired date in any of the time series shown on either the Model tab, the Tests tab or the Papers tab.
Clicking on a data point in any time series will link to the state of the model and the test results for the associated date.
Clicking the data point will link back to the same models page with data loaded for the selected date. The model info section displays the selected date as well as the date for the most recent data. Any time series show data up to the selected date. Any section showing new updates, such as “New Passed Tests”, shows what was new on the selected date while “All Test Results” shows the state of the results were in. Clicking on “Go To Latest” on the top panel will link back to the most recent state of the model.
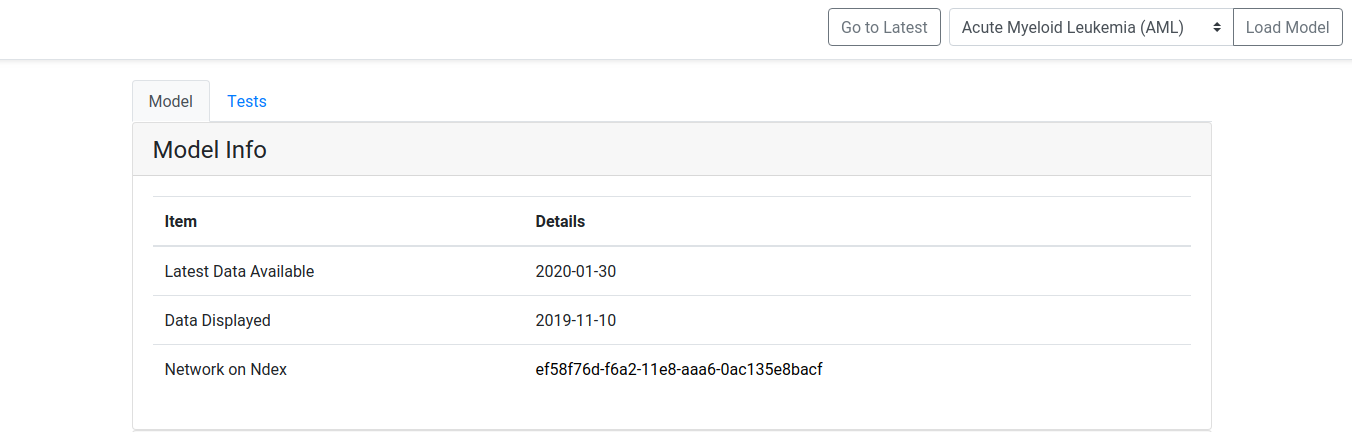
When the state of the model for a previous date is shown, the date is diplayed in “Data Displayed”. Clicking on “Go To Latest” on the top panel will link back to the most recent state of the model